Shifting gears to look at our monitored KPI footprints in our operations (manufacturing), we can see important trends developing in our greenhouse gas emissions reductions between 2019 and 2020 (see table below). In terms of absolute energy consumption, there was a Nutreco-wide increase from 1,318,163 MWh in 2019 to 1,420,344 MWh in 2020, a rise of 7.7%. This was a result of higher production tonnes. However, the respective conversion of this usage to CO2 – eq emissions was a 19% reduction between 2019 and 2020.

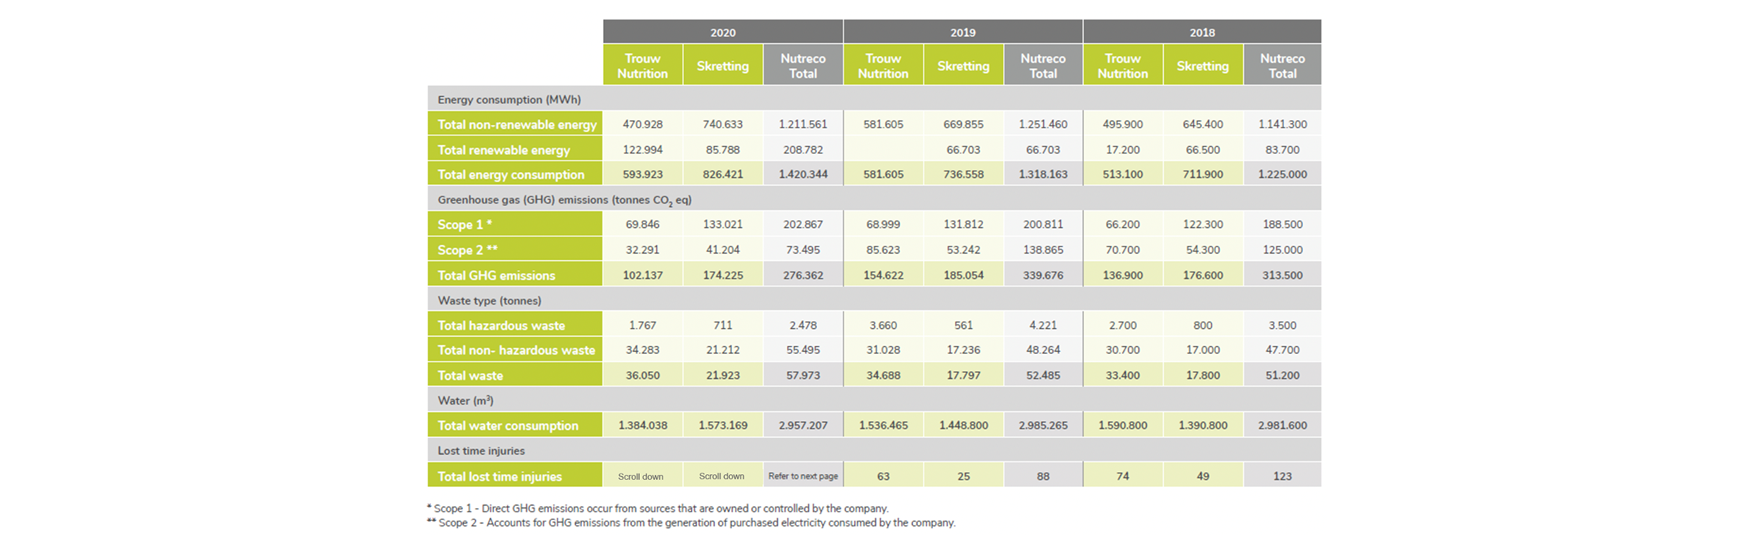
The leading driver for this reduction was the adoption of purchased green energy in Nutreco Iberia operations acrossall of Spain. This is reflected in the drop in CO2 emissions.

When interpreting emission reductions per production tonne sold, the reduction is even more significant (-27%) mainly because our Trouw Nutrition division typically has less footprint to manufacture a tonne of product and in 2020 our animal nutrition division sold more tonnes than our aquaculture division. Therefore, the ratios support less emissions per tonnes sold.

Last year also brought significant reductions to water usage. In absolute terms, we saw a reduction of just 1% to 2,957,207 tonnes from a 2019 usage of 2,985,265 tonnes. This was attributed to the closing of some Sada processing plants in Spain. However, significant reductions were observed on a per production tonne sold basis; where the 11% decrease is attributed to higher ratio of Trouw Nutrition production tonnage with low water footprint as compared to relatively lower Skretting production tonnage where we have the larger water usage footprint.

In 2021, Nutreco will perform a mapping exercise to identify the areas with water scarcity in the geographies where we operate in compliance with GRI guidelines.

Overall absolute results by division and consolidated 2020 vs 2019 vs 2018

In 2020, Nutreco ceased reporting the Lost Time Incidence (LTI) KPI in an effort to establish a more detailed picture of our Health & Safety (H&S) programme. Moving forward, Nutreco will focus on leading KPIs and an updated set of lagging KPIs. Since this change in KPI definition was enacted in the summer of 2020, full year on year comparisonare not possible.

The heads of H&S across all the SHV groups have decided to align the health and safety KPIs throughout the organisation. Total Recordable Case Frequency (TRCF) has been chosen as the lagging indicator because it has a very clear definition (OSHA), which is used internationally by organisations with a strong safety culture. This will enable us to benchmark externally. It’s also a more robust measurement because it includes both medical treatment and restricted work day cases, which enable a greater understanding of our risk profile and hence the areas we should address to reduce injury to our workforce. This will replace the reporting of LTIs, which has a variety of definitions across different companies and provides less information on the risk profile of an organisation.

The leading indicators were also aligned with all the groups measuring the positive actions being taken to reduce the risk profile in our organisation.